Cholinergic Modulation in Hereditary Retinal Disease: Stargardt Disease
Gerard M. Nolan, MD, FACS June 2026
Introduction
Stargardt disease was first described in 1909 by Karl Stargardt, who reported progressive central vision loss in young patients with initially normal fundus findings.1 Subsequent progression to macular atrophy with characteristic flecks is now well established.
Stargardt disease is the most common inherited macular dystrophy and is typically caused by autosomal recessive mutations in the ABCA4 gene.2 Other genes, including PROM1 and ELOVL4, may produce phenotypically similar conditions.3 The disease is progressive and historically associated with irreversible visual loss. Natural history studies, including the Progstar cohort, demonstrate measurable decline in visual acuity over time.4
In addition to central acuity loss, impairment of color vision is a consistent feature of the disease.5,6 Despite advances in gene and cell-based therapies, restoration of functional vision remains limited.
Cholinergic signaling plays a critical role in retinal processing, particularly within inner retinal circuits involving amacrine and ganglion cells.7,14,15 While topical cholinergic agents are traditionally associated with optical effects such as miosis and increased depth of focus, their potential impact on neural retinal processing has not been fully characterized.
Clinical observations suggest that cholinergic modulation may produce improvements exceeding those explainable by optical mechanisms alone. Notably, visual improvement has been observed in an eye with aniridia and in patterns inconsistent with localized optical effects.
This study evaluates visual outcomes following topical cholinergic therapy and examines whether findings support a neural, rather than purely optical, mechanism.
Methods
Study Design and Participants
This prospective, single-center observational study included 59 patients with genetically confirmed hereditary retinal disease. Diagnoses included ABCA4-associated disease as well as other genotypes, including PRPH2, CRX, PROM1, CRB1, CNGA3, VCAN, and retinitis pigmentosa. The study population had a mean age of 36.2 years (range, 8.8 – 86.8 years) at baseline and included patients from 7 countries and 23 U.S. states.
A total of 50 patients were diagnosed with Stargardt disease confirmed by a positive ABCA4 gene test. Patients were evaluated over a one-year period using a structured protocol consisting of nine visits. Following the initial evaluation phase, patients were scheduled for follow-up at 1 month, 6 months, and 12 months. Although several patients continued treatment beyond one year, those data were not included in the primary analysis. Due to logistical and financial constraints, not all patients completed the full one-year follow-up.
The study protocol and informed consent procedures were based on the original 2005 Institutional Review Board (IRB) approved pilot study, “A Pilot Open-Label Study of Low-Dose Ocular Echothiophate Iodide for the Treatment of Stargardt Disease” (IRB File No. 05175-01), with the current observational cohort conducted using the same standardized clinical methodology.25
All patients underwent standardized ophthalmic evaluation at each visit. Best-corrected visual acuity (BCVA) was measured according to Early Treatment Diabetic Retinopathy Study (ETDRS) guidelines and recorded as logarithm of the minimum angle of resolution (logMAR). A standardized clinical report form was used for all data collection.
Diagnostic Assessments
The following assessments were performed:
- Distance visual acuity at 4 meters
- Distance visual acuity at 1 meter
- Near visual acuity
- Color vision testing using the Ishihara Color Test (10 plates)
- Pupil size measurement under ambient lighting using slit-lamp biomicroscopy
- Slit-lamp examination with tonometry
- Computerized perimetry
- Optical coherence tomography (OCT)
- Fundus photography
- Genetic testing
- Fluorescein angiography (FA)
Treatment Protocol and Visit Schedule
Initial Visits (Visits 1 - 3)
| Day 1 | Baseline measurements of BCVA (4 meters, 1 meter, and near), color vision, and pupil size were obtained. |
| Day 2 |
Repeat measurements of BCVA, color vision and pupil size were performed to establish baseline stability. A combination of topical proparacaine 1%, pilocarpine 2% and echothiophate iodide (PI/ECHO) at concentrations of 0.0075% or 0.015% was administered. Patients were instructed to keep their eyes closed for 1 hour following administration. After 1 hour, BCVA (4 meters, 1 meter, near), color vision, and pupil size were reassessed. That evening, patients self-administered PI/ECHO into the lower cul-de-sac immediately prior to sleep. A maintenance regimen of PI/ECHO administration every other evening at bedtime was then initiated. |
| Day 3 | BCVA (4 meters, 1 meter, near), color vision, and pupil size were reassessed. |
Follow-Up Visits (Visits 4 - 9)
At all subsequent visits (1 month, 6 months, and 12 months), BCVA (4 meters, 1 meter, near), color vision, and pupil size were measured using the same standardized protocol.
Visual Acuity Assessment
BCVA was measured using ETDRS methodology and recorded in logMAR units for both distance and near vision.8 Snellen equivalents were derived for clinical interpretation.
Outcome Measures
Primary and secondary outcome measures included:
- Maximum Visual Improvement (MVI), defined as the greatest improvement from baseline
- One-year change in BCVA
- ETDRS letter gain, calculated as logMAR change divided by 0.028
Data Analysis
Descriptive statistical analysis was performed. Outcomes were evaluated across baseline severity, genotype, and distance versus near vision.
Data for analysis were derived from 59 patients (108 eyes). Baseline BCVA was established using measurements obtained at Visits 1 and 2; the poorer of the two values was selected as baseline.
Maximum visual improvement (MVI) was defined as the greatest improvement in BCVA observed at any follow-up visit relative to baseline. A single eye per patient was selected — the eye demonstrating the greatest improvement over the study period — resulting in a dataset of 59 eyes for primary analysis.
All BCVA measurements were analyzed in logMAR units in accordance with ETDRS standards. Changes from baseline were calculated in logMAR and converted to ETDRS letter scores for clinical interpretability using standard conversions:
- 1 ETDRS letter = 0.02 logMAR
- 1 line (5 letters) = 0.10 logMAR
For longitudinal analysis, the eye demonstrating the greatest improvement at each time point was used, consistent with the primary outcome methodology.
Data were analyzed using a predefined study cutoff date of May 5, 2026. Patients B049 - B059 had not yet reached the one year follow up milestone at the time of the analysis and were therefore included in baseline and early follow-up analysis only.
Observed Pharmacologic and Physiologic Properties
Several clinical observations suggested that the therapeutic response was not explained solely by an optical pinhole effect from miosis:
- Timing requirement: Medication administered at bedtime required approximately six hours of uninterrupted sleep for efficacy; shorter duration resulted in loss of effect.
- Bilateral crossover effect: Unilateral administration produced bilateral improvement in visual function, including miosis in the contralateral untreated eye.
- Paradoxical sensory improvement: Patients reported increased light sensitivity and improved color perception despite pupillary constriction, contrary to expectations from reduced retinal illumination.
- Prolonged duration of effect: A single bedtime application produced visual improvement lasting up to one week, exceeding expected pharmacokinetic duration.
- Dose sensitivity: Therapeutic effect was observed at concentrations as low as 0.0025% but was lost above 0.03%, suggesting a narrow physiologic therapeutic range.
- Resistance to pharmacologic reversal: Visual improvement persisted despite reversal of miosis with topical phenylephrine 10% or tropicamide administered 1 – 2 days after treatment.
- Reversibility after discontinuation: Discontinuation of therapy resulted in loss of visual gains approximately six days after the final dose.
- Partial recovery after reinitiation: Reinitiation of therapy produced only partial recovery above baseline in some patients (e.g., Patient B007).
- Inhibition by anticholinergic agents: The therapeutic response appeared to be inhibited by topical atropine or systemic medications with anticholinergic effects, supporting involvement of cholinergic retinal pathways.
Results
Table 1 summarizes the visual outcomes of all 59 patients, including patient number, diagnosis, baseline BCVA, MVI, and visual outcomes at 1 year.
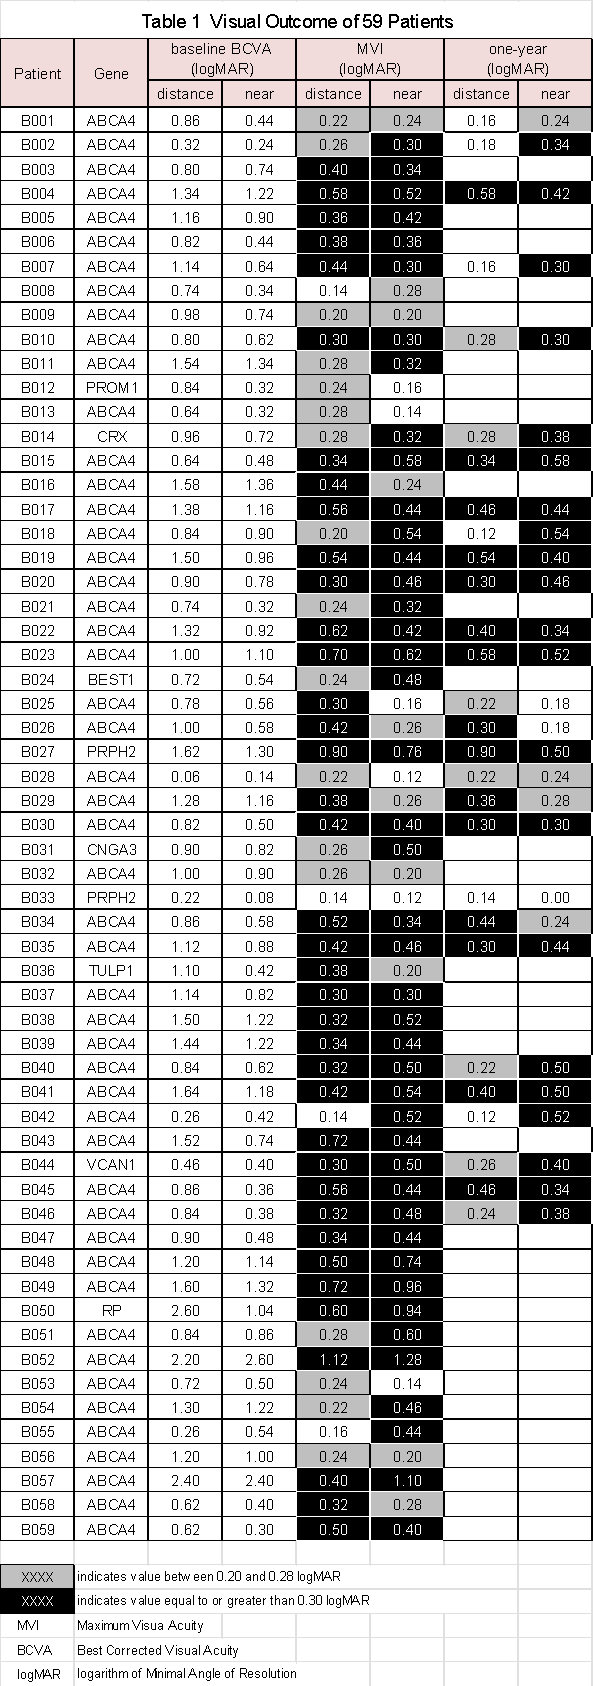
Patients B049 to B059 were enrolled more recently and had not yet completed one year follow up at the time of the data lock.
Familial Clustering
Several patients in the cohort were members of the same families, including:
- B001 and B042
- B051 and B058
- B019, B022, B026 and B032
- B045 and B046
Notably, patients B045 and B046 were monozygotic (identical) twins.
Treatment Interruption (Patient B007)
Patient B007 discontinued therapy twice during the first year, each for approximately three weeks. The first interruption, occurring at 3 months, resulted in a return to baseline visual acuity, followed by recovery and subsequent improvement to the previously observed maximum visual improvement (MVI) after resumption of therapy.
The second interruption, at one year, again resulted in regression to baseline. Upon reinitiation of treatment, visual acuity improved; however, the magnitude of recovery was significantly reduced compared with the prior MVI, suggesting incomplete restoration of the therapeutic effect after repeated discontinuation.
Results
Cohort and Baseline Characteristics
A total of 59 patients were included in the analysis (Table 1). The cohort was predominantly composed of patients with ABCA4-associated disease, with additional genotypes including PROM1, CRX, CRB1, PRPH2, CNGA3, VCAN, BEST, and retinitis pigmentosa.
Baseline best-corrected visual acuity (BCVA) ranged from 0.06 to 2.60 logMAR (20/25+2 to 20/8000), reflecting a broad spectrum of disease severity.
Maximum Visual Improvement
MVI range for distance and near BCVA are as follows:
- Distance MVI: 0.14 – 1.12 logMAR (7 – 56 ETDRS letters)
- Near MVI: 0.12 – 1.28 logMAR (6 – 64 ETDRS letters)
Among 59 treated patients, the mean Maximum Vision Improvement (MVI) was 3.8 ETDRS lines for distance vision and 4.3 lines for near vision.
MVI improvement of 3 lines or greater occurred in 38/59 patients (64.4%) for distance vision, 43/59 patients (72.9%) for near vision, and 49/59 patients (83.1%) for either distance or near vision. Improvement of 2 lines or greater occurred in 55/59 patients (93.2%) for distance vision, 53/59 patients (89.8%) for near vision, and 58/59 patients (98.3%) for either modality.
Improvement of 4 lines or greater occurred in 22/59 patients (37.3%) for distance vision and 33/59 patients (55.9%) for near vision, while five lines of improvement or greater occurred in 14/59 patients (23.7%) for distance vision and 17/59 patients (28.8%) for near vision.
Distance Versus Near Outcomes
Near visual acuity frequently demonstrated greater improvement than distance vision. Representative examples include:
- B040: 16 vs 25 letters (distance vs near)
- B050: 30 vs 47 letters
- B057: 20 vs 55 letters
This pattern of preferential near improvement was consistently observed across the cohort.
One-Year Outcomes
Among 28 patients followed for one year, the mean sustained improvement was 3.3 ETDRS lines for distance vision and 3.6 lines for near vision. Improvement of 3 lines or greater persisted in 15/28 patients (53.6%) for distance vision, 21/28 patients (75.0%) for near vision, and 24/28 patients (87.5%) for either modality.
At 1 year, improvement of 2 lines or greater was maintained in 22/28 patients (78.6%) for distance vision, 25/28 patients (89.3%) for near vision, and 27/28 patients (96.4%) for either distance or near vision.
Additional Clinical Observations
WHO visual impairment analysis demonstrated a clear relationship between baseline disease severity and treatment response (Table 2). Appendix A shows the definition of the WHO classifications. Patients with the greatest baseline visual impairment experienced the largest visual gains, whereas those with mild baseline impairment showed the smallest improvements. For distance vision, mean Maximum Vision Improvement (MVI) increased progressively from 0.20 logMAR (10 ETDRS letters) in the mild and normal categories to 0.58 logMAR (29 ETDRS letters) in the blindness category. A similar trend was observed for near vision, with minimal improvement in the mild category and the greatest improvement in the blindness category, where mean near-vision MVI reached 0.78 logMAR (39 ETDRS letters). These findings suggest that patients with the most advanced visual impairment demonstrated the greatest functional responsiveness to treatment, likely reflecting a ceiling effect due to relatively preserved initial visual function.
Table 2 and Figure 1 summarize the visual outcomes of all 59 patients by WHO Classification.
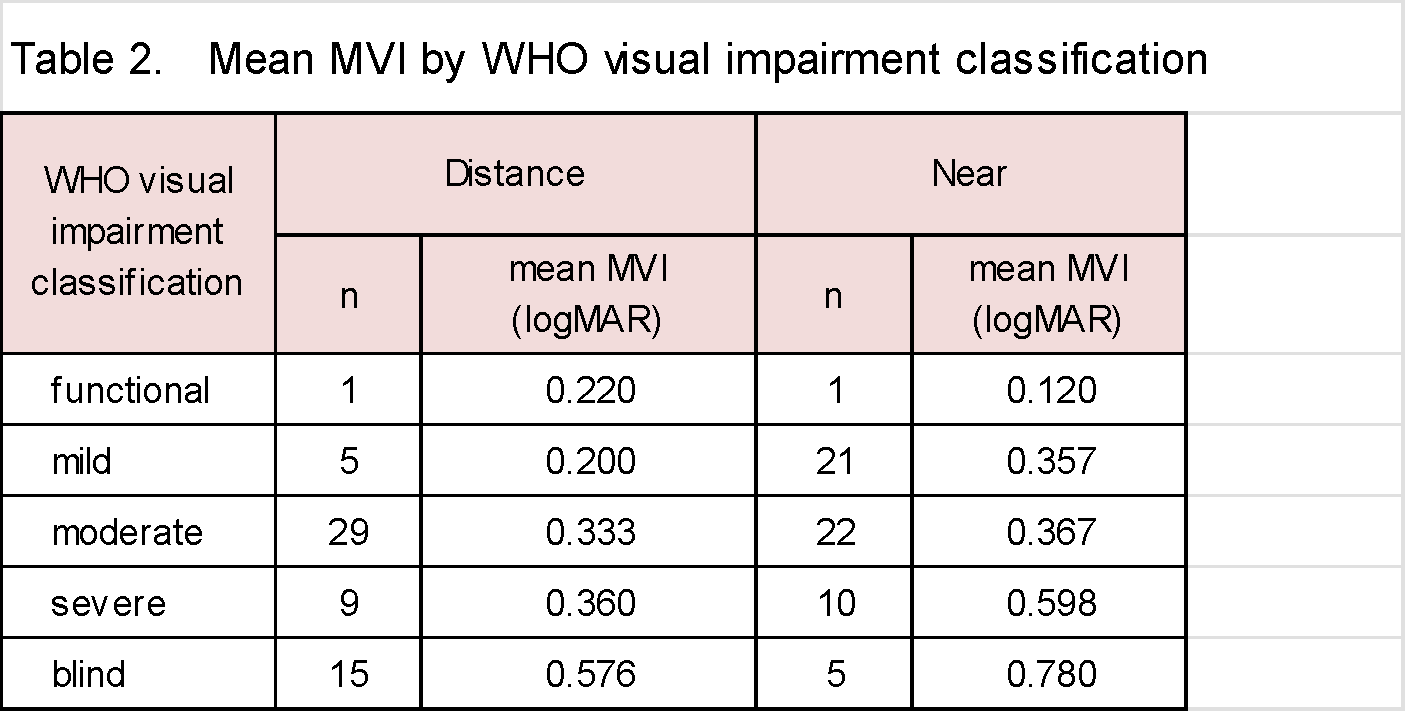
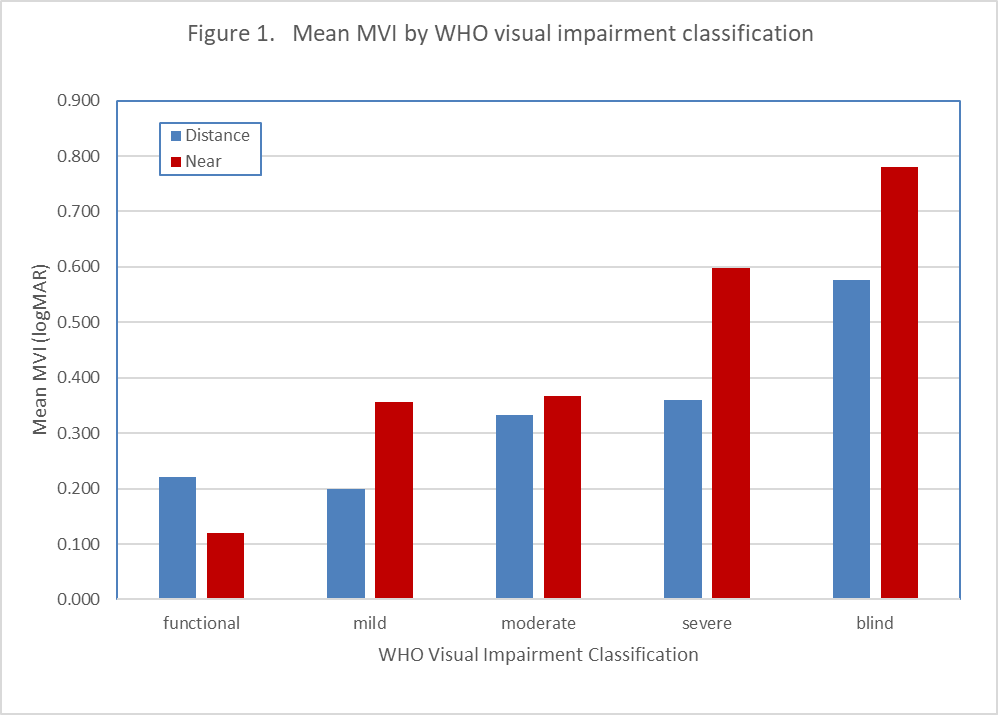
Visual improvement increased progressively with worsening baseline WHO visual impairment category. The greatest distance and near-vision improvements occurred in the blindness category, while the mild and normal categories demonstrated the smallest gains.
Fluorescein angiographic analysis of 50 patients with Stargardt disease identified two distinct patterns of retinal pigment epithelium (RPE) involvement:
- localized central macular RPE atrophy (Stage III) in 46% of patients, characterized predominantly by limited cone dysfunction, and
- diffuse RPE atrophy involving both the macula and extramacular retina (Stage IV) in 52%, suggesting more extensive cone and/or rod dysfunction.5,6
Appendix B shows the four stage system for classifications.
Baseline visual acuity differed substantially between groups, with mean BCVA measuring 0.85 logMAR in Stage III patients versus 1.24 logMAR in Stage IV patients, representing an average difference of 3.8 ETDRS lines. These findings are comparable to a prior 309-patient study reporting baseline BCVA values of 0.88 and 1.12 logMAR, respectively.8,13
Clinically, both stages presented with reduced visual acuity; however, Stage IV diffuse disease was associated with markedly greater color vision loss and functional impairment. For example, Patient B002 (Stage III localized disease) demonstrated baseline visual acuity of 0.32 logMAR with preserved color vision (100%), whereas Patient B019 (Stage IV diffuse disease) had baseline visual acuity of 1.50 logMAR with complete loss of color vision (0%).
Application of World Health Organization blindness criteria further demonstrated that 93% of patients meeting blindness criteria exhibited Stage IV diffuse RPE atrophy, while only 7% had Stage III localized disease.
Patient B019 and sibling B022 are representative examples of Stage IV diffuse disease within the WHO blindness category, supporting the association between diffuse extramacular RPE involvement and more severe visual dysfunction and color vision loss.21
Figure 2 compares fluorescein angiograms of Patients B002 and B019.
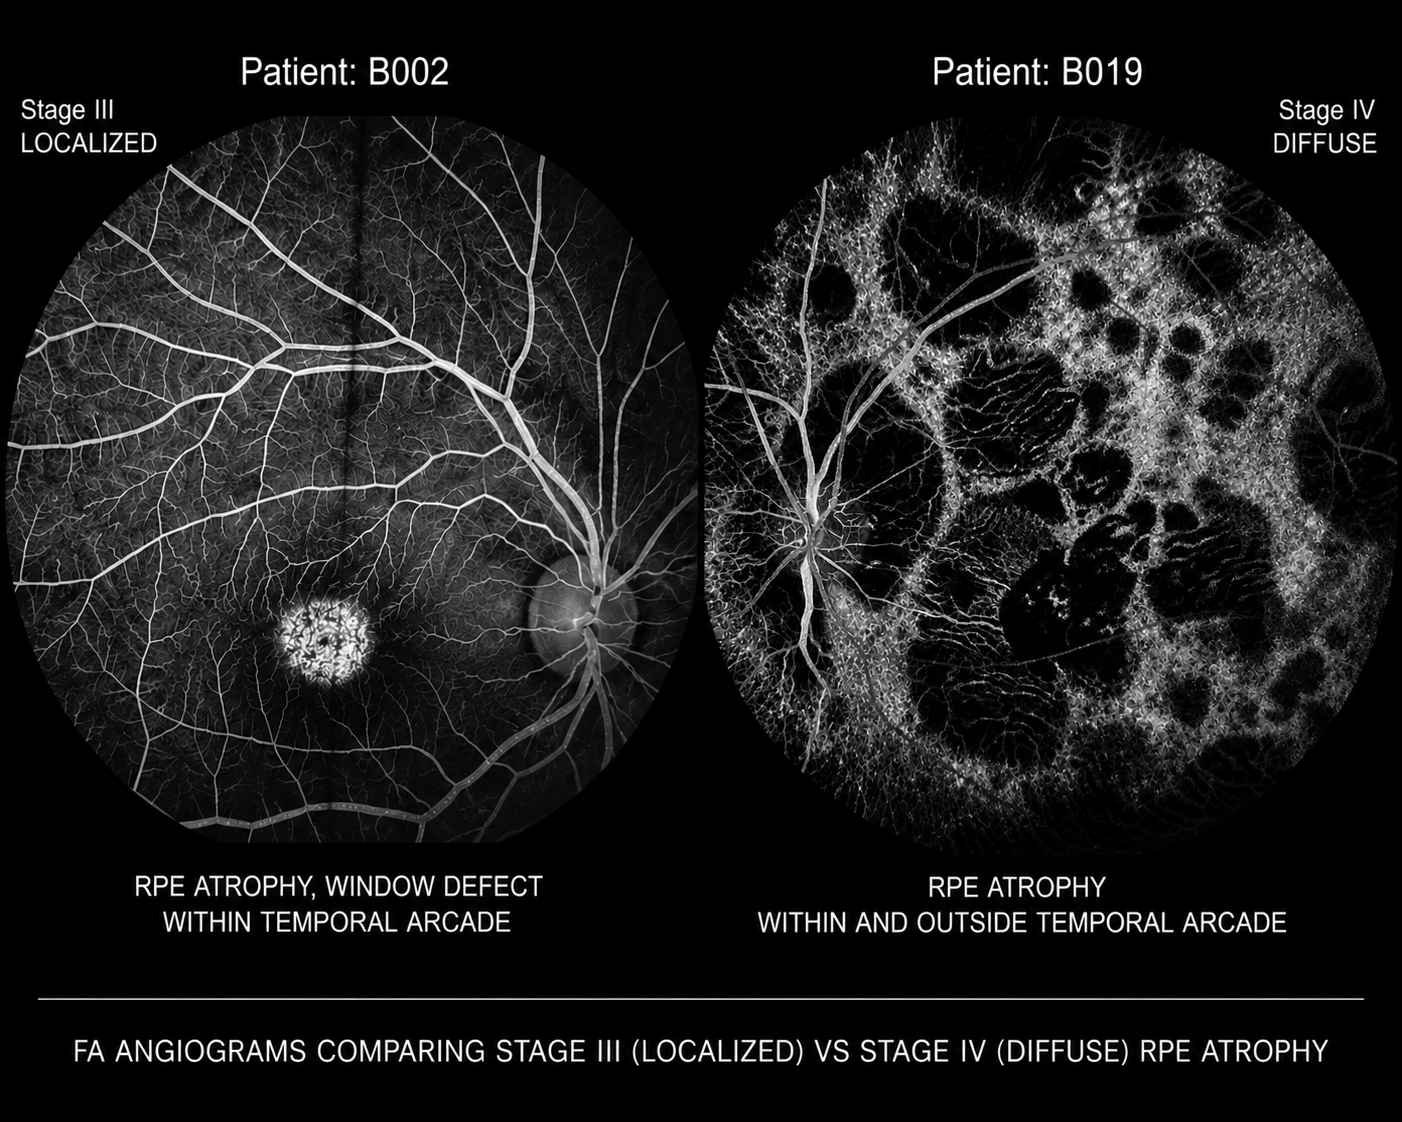
Figure 2 – Fluorescein Angiograms comparing Stage III (localized) vs Stage IV (diffuse) RPE atrophy.
Color vision was assessed using the Ishihara Color Test (10 plates). Color vision deficiency has previously been reported in patients with Stargardt disease.5,6 In this study, 46 of 50 patients (92%) demonstrated color vision deficiency at baseline in at least one eye. Mean color vision improved by 2.9 Ishihara plates, with improvements ranging from 0 to 8 plates. These findings are comparable to those of a prior 309-patient study, which reported an 85% baseline incidence of color vision deficiency and a mean improvement of 2.7 Ishihara plates following treatment.23 In this 309-patient study, two patients demonstrated dramatic recovery of color vision, improving from absent color vision (0 and -1 Ishihara plates) to normal color vision (10/10 plates).
Mechanistic Interpretation
The observed pattern of visual improvement is not fully explained by a purely optical pinhole mechanism. Key findings include:
- Improvement observed in a patient with aniridia (absence of iris), where miosis cannot occur11
- Persistence of visual gains despite pharmacologic reversal of miosis11
- Magnitude of improvement exceeding expected optical depth-of-focus effects10
- Bilateral visual improvement following unilateral treatment
- Concurrent improvement in color vision, which is not attributable to optical mechanisms5,6
Collectively, these findings support a biologically mediated neural mechanism, consistent with cholinergic modulation of inner retinal processing.
Discussion
The present observations trace their origin to 1999, when evidence suggestive of cholinergic modulation of inner retinal processing in dry age-related macular degeneration (AMD) was first identified during investigations of cholinergic therapy for presbyopia.9,17,18 These preliminary findings were subsequently communicated to colleagues at New York-Presbyterian/Weill Cornell Medical Center, the University of Connecticut Health Center, and the National Eye Institute, as well as to patent counsel. Following execution of non-disclosure agreements, this intellectual property was shared with major pharmaceutical companies, including Pfizer/Wyeth, Merck, Alcon, and Allergan. Notably, Allergan subsequently advanced cholinergic-based therapy for the treatment of presbyopia.
At the time, these observations were met with substantial skepticism, largely due to the absence of an established physiologic mechanism capable of explaining the reported visual improvements. The prevailing interpretation centered on a presumed pinhole effect.10 However, this hypothesis does not adequately account for the full range of observed outcomes. A 2001 patent illustration included Patient 29, a case of dry AMD with aniridia, in whom the magnitude and character of visual improvement could not reasonably be attributed to a pinhole mechanism alone.11,19,20,21,33 This observation suggests the involvement of non-optical factors, potentially related to modulation of inner retinal processing.
Additional support for a retinal, rather than purely optical, mechanism is derived from early clinical experience in inherited retinal disease. In June 2001, a patient with advanced Stargardt disease was treated. This 27-year-old individual (A260), previously dependent on a guide dog, demonstrated marked functional improvement following intervention, including restoration of color perception and sufficient visual function to obtain a driver’s license and achieve independent living.12,19,20,24,29 The magnitude of improvement observed in this case is not readily explained by optical mechanisms alone and is more consistent with modulation of residual retinal function.
Following this initial case, several hundred patients with Stargardt disease have been treated. In 2022, coinciding with the expiration of key patents and relaxation of prior regulatory constraints on dissemination, a cohort of 309 patients (A001 – A309) was formally documented.13,23 This analysis proposed a four-stage classification system for Stargardt disease and applied World Health Organization visual impairment categories to quantify outcomes. Longitudinal data demonstrated visual improvement and/or stabilization at 1-year, 5-year and ≥10-year intervals, suggesting durability of effect. Within this cohort, 25 patients were evaluated under Institutional Review Board oversight, with systematic documentation of color vision improvement.25
More recently, the present series of 59 treated patients was evaluated, of whom 50 had genetically confirmed Stargardt disease associated with ABCA4 mutations. This cohort included a family of four consecutive siblings (B019, B022, B026, and B032), allowing intra-familial comparison. Visual acuity gains and stabilization were documented across multiple time points, 1 hour, 1 day, 1 month, 6 months, and 1 year, along with detailed functional outcomes and patient-reported improvements in activities of daily living.22
This study demonstrates substantial and sustained improvement in visual acuity following topical cholinergic therapy in a heterogeneous cohort of hereditary retinal disease patients. At one year, 53.6% of patients achieved three lines or greater improvement in distance vision, 75.0% in near vision, and 85.7% in either modality. These outcomes compare favorably with results reported in many contemporary retinal therapeutic trials.
A central question addressed in this study is whether these improvements can be explained by optical mechanisms alone. The classical explanation for cholinergic-induced visual improvement is the pinhole effect, whereby miosis increases depth of focus.10 However, several findings challenge this interpretation.
First, significant visual improvement was observed in an eye lacking an iris, in which miosis, and therefore a pinhole effect, is not possible.11,21 Second, the magnitude of improvement was substantial, with gains of ≥30 ETDRS letters observed in 18.6% of patients. These levels of improvement exceed what would be expected from optical depth-of-focus changes alone.10
Third, the observation of bilateral improvement following unilateral treatment, along with delayed onset of effect, is inconsistent with a purely optical mechanism and instead suggests modulation of neural processing within the retina and visual pathways.
The pattern of enhanced near visual acuity further supports a neural mechanism, as near vision gains frequently exceeded distance gains. This finding is not readily explained by optical factors alone and is more consistent with improved signal processing and contrast sensitivity within inner retinal circuits.
These clinical observations are consistent with current understanding of retinal neurobiology. In outer retinal diseases, inner retinal structures, including bipolar, amacrine, and ganglion cells, are often relatively preserved (Appendix C).7,14,15,16 Pharmacologic inhibition of acetylcholinesterase increases acetylcholine availability, thereby enhancing cholinergic neurotransmission through both nicotinic and muscarinic receptors.14,15 This modulation may increase signal gain and improve downstream visual processing within surviving neural circuits. In addition, acetylcholine receptors are known to influence retinal blood flow and metabolic activity, further supporting a physiologic mechanism.
Taken together, these findings support the hypothesis that cholinergic modulation influences inner retinal processing in a manner that enhances functional vision, even in the presence of outer retinal disease.
Conclusion
Topical cholinergic modulation was associated with substantial and sustained improvements in visual acuity and color perception across a spectrum of hereditary retinal diseases. The magnitude, durability, and physiologic characteristics of these effects are not adequately explained by optical mechanisms alone and instead support a model of enhanced inner retinal processing, suggesting a potentially complementary therapeutic strategy alongside emerging gene and cell-based approaches.
Appendix A
World Health Organization International Visual Impairment Categories:
| • | Functional | BCVA | ≤ 0.10 logMAR (20/25 or better) |
| • | Mild | BCVA | 0.12 - 0.54 logMAR (20/25 - 1 to 20/70) |
| • | Moderate | BCVA | 0.56 - 1.0 logMAR (20/70 - 1 to 20/200) |
| • | Severe | BCVA | 1.02 - 1.30 logMAR (20/200 - 1 to 20/400) |
| • | Blind | BCVA | ≥ 1.32 logMAR (less than 20/400) |
Appendix B
Four-stage classification system for Stargardt disease:
| Stage I | Flecks are present locally in the macula and between the temporal arcades, no atrophy of the retinal pigment epithelium (RPE) |
| Stage II | Flecks are diffusely present, temporally in macula, but also above or below the temporal arcade, and/or nasally, no atrophy of the RPE |
| Stage III | Localized disease as in Stage I, RPE Atrophy |
| Stage IV | Diffuse disease as in Stage II, RPE Atrophy |
Appendix C
Stargardt disease shows RPE and cone rod pathology in outer retinal structures but, inner retinal structures including bipolar, amacrine, and ganglion cells are relatively preserved. See Figure C1.
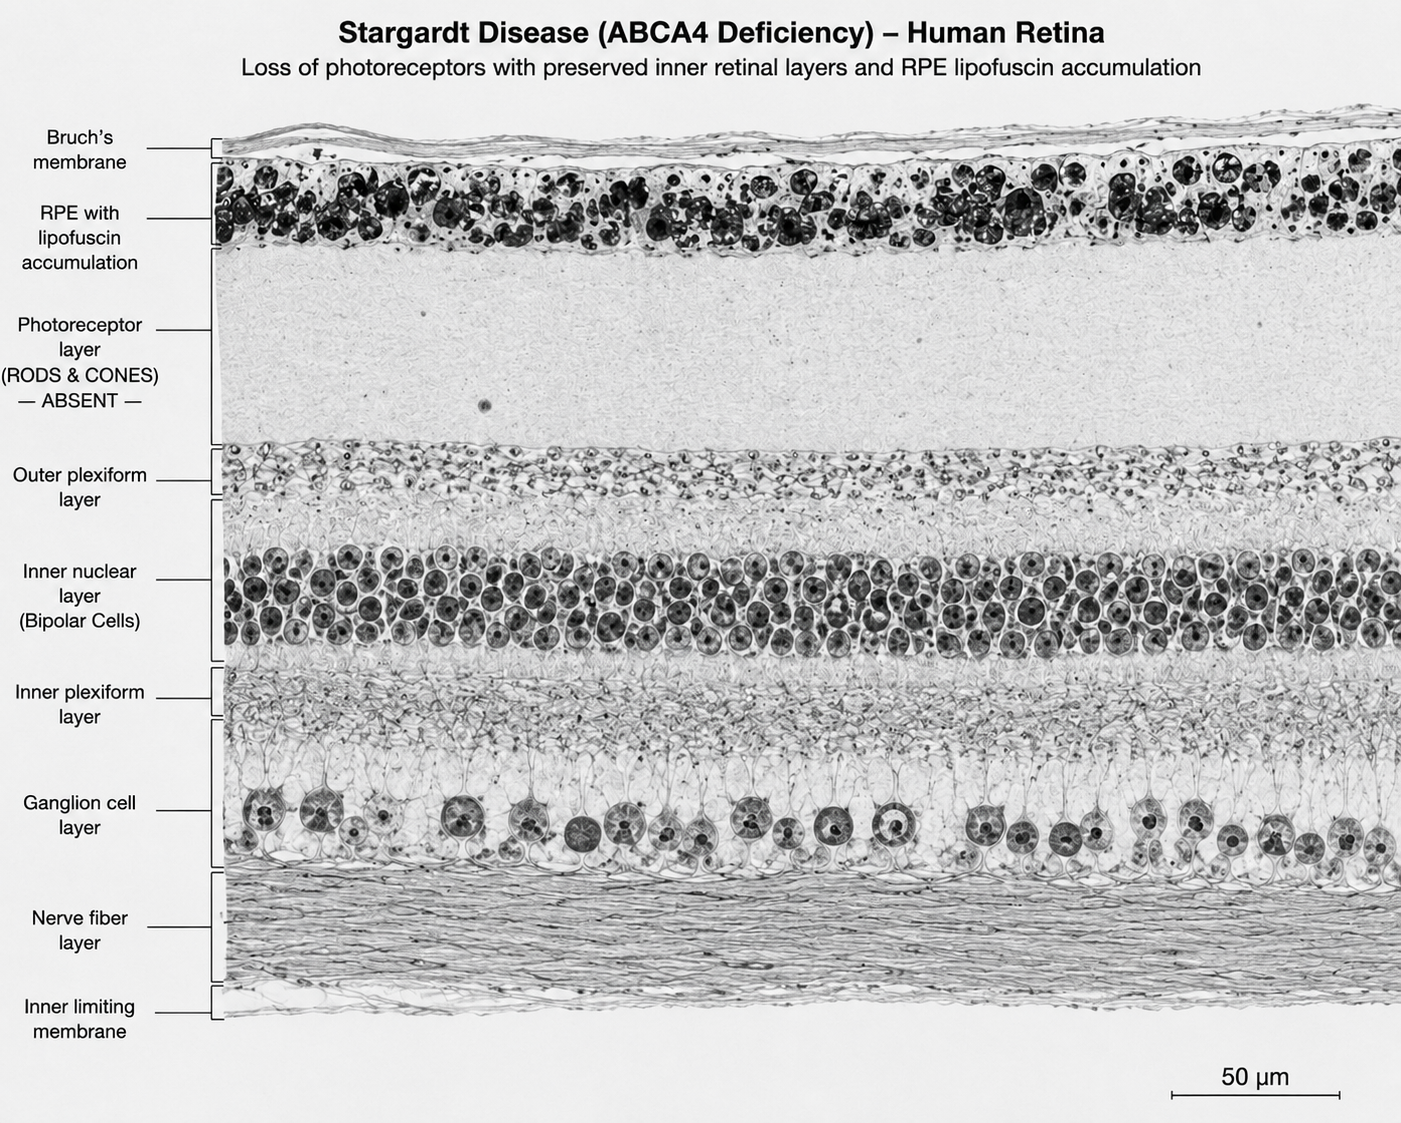
Figure C1 – Stargardt disease human retina, showing loss of photoreceptors (rods and cones) in the outer segment structure and showing preserved inner retinal structure (bipolar, amacrine and ganglion cell layers). Author-generated composite image based on published SD-OCT retinal layer anatomy and Stargardt disease imaging studies.30,31,32
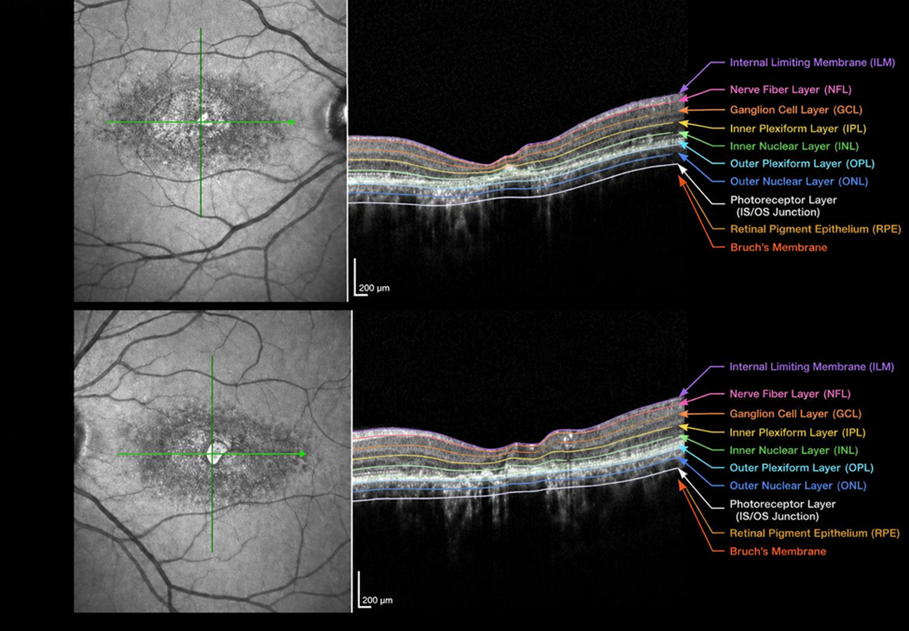
Figure C2 – Stargardt disease fundus, Optical Coherence Tomography showing retinal thinning of the outer segment. Author-generated composite image based on published SD-OCT retinal layer anatomy and Stargardt disease imaging studies.30,31,32
These findings support the concept that, despite substantial outer retinal and RPE degeneration, portions of the inner retinal structure remain anatomically preserved in Stargardt disease, a feature potentially relevant to mechanisms of functional visual improvement and inner retinal modulation.
References
- Karl Stargardt. Über familiäre progressive Degeneration in der Makulagegend des Auges. Albrecht von Graefes Arch Ophthalmol. 1909.
- Rando Allikmets, et al. A photoreceptor cell–specific ATP-binding transporter gene (ABCR) is mutated in recessive Stargardt macular dystrophy. Science. 1997.
- Michel Michaelides, et al. Stargardt disease. Prog Retin Eye Res. 2018.
- Rupert W. Strauss, et al. Progstar Report No. 6. JAMA Ophthalmol. 2016.
- Sylvia Lambertus, et al. Early-onset Stargardt disease: phenotypic and genotypic characteristics. Ophthalmology. 2015.
- Keiko Fujinami, et al. Clinical and molecular characteristics of Stargardt disease. Invest Ophthalmol Vis Sci. 2013.
- Richard H. Masland. The neuronal organization of the retina. Nat Rev Neurosci. 2012.
- Frederick L. Ferris III, et al. New visual acuity charts for clinical research. Arch Ophthalmol. 1982.
- Nolan GM. Internal clinical observations regarding cholinergic modulation of retinal processing. 1999.
- Fergus W. Campbell, David G. Green. Optical and retinal factors affecting visual resolution. J Physiol. 1965.
- Nolan GM. Methods for Treating Certain Eye Diseases. US Patent 6,605,640 B2. Issued August 12, 2003.
- Nolan GM. Clinical case report: Stargardt disease treated with topical cholinergic therapy. 2001.
- Nolan GM. Stargardt cohort analysis of 309 patients treated with topical echothiophate iodide. 2022.
- Keith T. Keyser, et al. Cholinergic neurons in the retina. J Comp Neurol. 2000.
- Michelangelo Piccolino, et al. Cholinergic mechanisms in retinal neurotransmission. Trends Neurosci. 1995.
- Retinal remodeling and neural plasticity in inherited retinal degeneration. Prog Retin Eye Res. 2012.
- Nolan GM. Methods for Treating Various Eye Disorders. US Patent 6,273,092 B1. Issued August 14, 2001.
- Nolan GM. Physiological Method of Improving Vision. US Patent 6,540,990 B2. Issued April 1, 2003.
- Nolan GM. Methods for Treating Certain Eye Diseases. US Patent 6,605,640 B2. Issued August 12, 2003.
- Nolan GM. Physiological Methods of Improving Vision (Stargardt Disease). US Patent 7,915,312 B2. Issued March 29, 2011.
- Nolan GM. Physiologic/Pharmacologic Topical Cholinergic Modulation of Retinal Disease: Evidence Against a Purely Optical Mechanism. 2026.
- Nolan GM. Stargardt disease treatment in four siblings using acetylcholinesterase inhibition. 2025.
- Nolan GM. Topical echothiophate iodide in Stargardt disease: outcomes in 309 patients. 2021.
- Nolan GM. Successful management of Stargardt disease using diluted echothiophate iodide. 2003.
- Institutional Review Board, Inc. IRB File No. 05175-01. A Pilot Open-Label Study of Low-Dose Ocular Echothiophate Iodide for the Treatment of Stargardt Disease. Principal Investigator No. 5575-001. Corte Madera, California; November 23, 2005.
- Nolan GM. Stargardt disease treatment with topical acetylcholinesterase inhibitor medication (low-dose echothiophate iodide): Patient 61. September 2021.
- Nolan GM. Stargardt disease treatment with topical acetylcholinesterase inhibitor medication (low-dose echothiophate iodide): Patient 86. September 2021.
- Nolan GM. Stargardt disease treatment with topical acetylcholinesterase inhibitor medication (low-dose echothiophate iodide): Patient 247. September 2021.
- Nolan GM. Stargardt disease treatment with topical acetylcholinesterase inhibitor medication (low-dose echothiophate iodide): Patient 260. September 2021.
- Cideciyan et al., ABCA4-associated retinal degenerations spare structure and function of the human parapapillary retina (IOVS, 2005).
- Huang et al., Inner and outer retinal changes in retinal degenerations associated with ABCA4 mutations (IOVS, 2014).
- Lenis et al., Localization of ABCA4 in the Retinal Pigment Epithelium and Implications for Stargardt Disease (IOVS, 2018).
- Nolan GM. Visual Improvement in an Aniridic Patient Following Topical Acetylcholinesterase Inhibition: Evidence Against a Purely Pinhole Mechanism. June 2026.
- Nolan, GM. Nolan Eye and Laser, Stargardt Disease Treatment, Jan 2022, June 2026, June 2026, Stargardtdiseasetreatment.com.
Abbreviations and Acronyms:
ACh = Acetylcholine; AChEI = Acetylcholinesterase Inhibitor; BCVA = Best Corrected Visual Acuity; CP = Computerized Perimetry; ETDRS = Early Treatment Diabetic Retinopathy Study; FA = Fluorescein Angiogram; FDA = Food and Drug Administration; logMAR = Logarithm of the Minimum Angle of Resolution; MVI = Maximum Visual Improvement; OCT = Optical Coherence Tomography; PI/ECHO = Phospholine Iodide® / Echothiophate Iodide; RPE = Retinal Pigment Epithelium